Python 标签云拟合图片
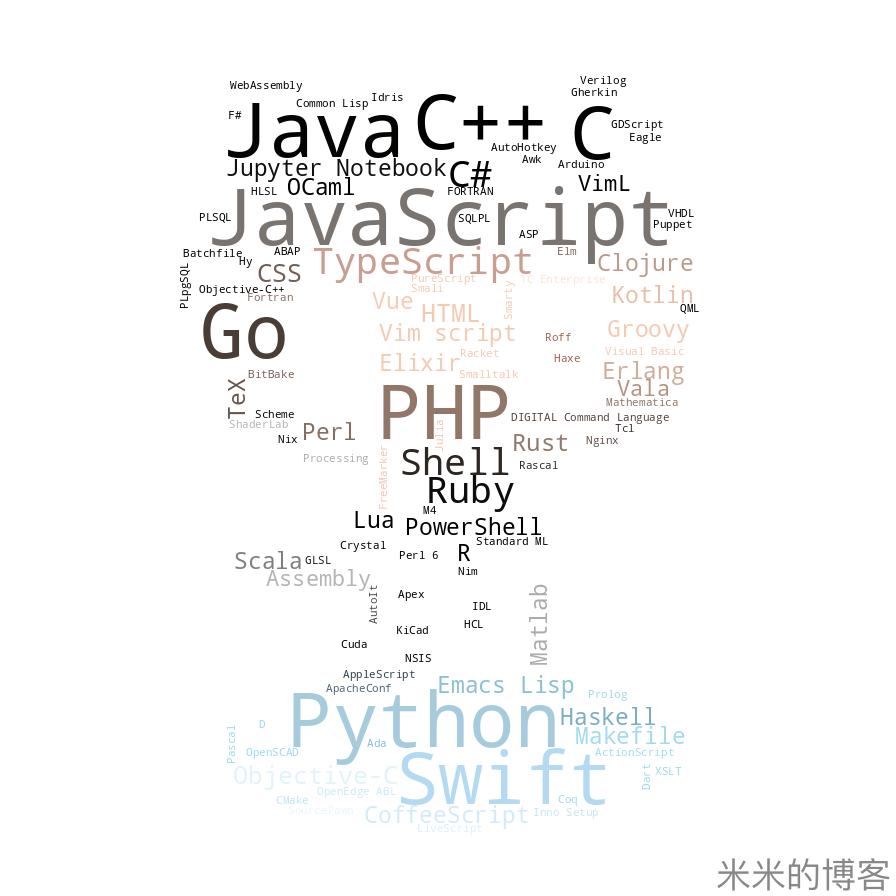
笔者最近发现了一个神奇的 Python 库,名为 wordcloud。借助它,可以轻松地用标签云拼出一副图片,就像上图这样。让我们一起看看具体的步骤吧。
环境
请确保 Python 3 和 pip3(即python3 -m pip)都可以正常使用。需要使用 pip 安装的模块有:
- matplotlib
- numpy
- pillow
- requests
- wordcloud
其中wordcloud模块有些特殊,笔者尝试执行pip3 install wordcloud,结果报错了。如果你也遇到了类似的问题,请执行以下安装方式:1
2
3
4git clone https://github.com/amueller/word_cloud.git
cd word_cloud
pip3 install -r requirements.txt
python3 setup.py install
这样就完成安装了。
代码
标签云自然需要每个标签的文本和权重(也就是显示的相对大小)。wordcloud库中的WordCloud类提供了方法generate_from_frequencies,接收一个字典作为参数。标签的文本和权重就需要在这个字典中给出,形式是这样的:1
2
3
4
5
6
7
8
9
10frequencies = {
"JavaScript": 18,
"Python": 16,
"Java": 13,
"Go": 8,
"TypeScript": 7,
"C++": 7,
"Ruby": 6,
"PHP": 5
}
当然,这个字典不一定需要自己写,也可以通过一些语料库获得。官方的 Demo 中就有统计一段文本中的词频来作为标签云。
下面的例子是用requests获取 GitHub 上热度最高的语言,然后作为标签云拼出 GitHub 的吉祥物 Octocat:1
2
3
4
5
6
7
8
9
10
11
12
13
14
15
16
17
18
19
20
21
22
23
24
25
26
27
28
29
30#!/usr/bin/env python3
import numpy as np
import json
from PIL import Image
from wordcloud import WordCloud, ImageColorGenerator
import matplotlib.pyplot as plt
import requests
r = requests.get("https://cdn.jsdelivr.net/gh/madnight/githut@master/src/data/gh-star-event.json")
jsondict = json.loads(r.text)
r = requests.get("https://octodex.github.com/images/original.png", stream=True)
pic = np.array(Image.open(r.raw).convert("RGBA"))
pic[np.where(pic[:, :, 3] == 0)] = 255
frequencies = {}
for entry in jsondict:
if entry["year"] == "2018" and entry["quarter"] == "1":
frequencies[entry["name"]] = np.log(int(entry["count"]))
image_colors = ImageColorGenerator(pic, [255,255,255])
wc = WordCloud(background_color="white", mask=pic)
wc.generate_from_frequencies(frequencies)
plt.imshow(wc.recolor(color_func=image_colors), interpolation="bilinear")
wc.to_file("octocat.png")
plt.axis("off")
plt.show()
你可以自行替换原始数据和图片,例如下面这张:

图片支持多种格式,但为了保证效果,非主体部分应填充白色。
保存后使用 Python 3 执行以上代码,即可得到拟合出的图片。